I am using an Ensenso X36 camera and analyzing capture times. I have noticed that the times shown in NxView are lower than those measured when using the API. To verify this, I implemented a minimal example to measure the execution time of the cmdCapture command:
nxLibInitialize(true);

std::string cameraSerial = "171375";
auto camera = NxLibItem()[itmCameras][cameraSerial];

std::string serial = camera[itmSerialNumber].asString();
std::cout << "Opening camera " << serial << std::endl;
NxLibCommand open(cmdOpen);
open.parameters()[itmCameras] = serial;
open.execute();

setJson(camera);

std::cout << "Grabbing an image" << std::endl;
auto start = std::chrono::high_resolution_clock::now();
NxLibCommand(cmdCapture).execute();
auto end = std::chrono::high_resolution_clock::now();
auto duration = std::chrono::duration_cast<std::chrono::milliseconds>(end - start);

std::cout << "Elapsed time: " << duration.count() << " ms" << std::endl;
In NxView, the capture time is approximately 300 ms, while the same operation in my example takes 450 ms.
I would like to understand the reason for this difference and whether there is anything I can do to make my API measurements closer to the times observed in NxView.
I am attaching the full code I am running, along with the camera configuration file, to help reproduce the issue. configuration.json (20.9 KB) nxGrab.cpp (3.4 KB)
Any insights or suggestions would be greatly appreciated!
the NxProfiler is a very helpful tool for performance analysis. We have a guide on exporting profiling information in our manual. There is currently no guide on using the NxProfiler, but it is mostly quite intuitive. I would encourage you to try it out.
We also have an optimization guide where you will find helpful guidelines.
Did you let NxView run continuously in live mode or did you use the snapshot button to capture only a single image at a time? The capture time in snapshot mode should be similar to the one from the example. But in live mode, NxView interleaves image capture and processing, and only displays the time it actually had to wait after all the processing is done. It does this by using Trigger and Retrieve instead of the monolithic Capture command.
If the guides are not of sufficient help to you, please let me know, and if you have further concrete questions or comparisons, please send along some log files.
Thank you for your response. I have been using the NxProfiler, and I am attaching the log files for reference.
However, I am having some difficulties understanding the behavior of the Retrieve command. It seems to be executing in a single thread, even though I manually set the threads parameter to 12 in Nxview. Could you clarify if this is the expected behavior?
Additionally, I am trying to understand why the Retrieve operation takes 1.2 seconds when the exposure time is set to 10 ms and flexview is set to 12. I have attached both the configuration file and the log file for further details. 2025_2_12 C57 Test.json (21.3 KB) tmp_NxView.enslog (8.8 MB)
Any insights you could provide would be greatly appreciated.
This is expected: the Retrieve command always uses only a single thread, regardless of the value of the Threads parameter.
First off, you have texture capture enabled, so you are capturing an additional image pair (with the front light on instead of the projector) to be used as texture for the rendered point cloud and the overlay in NxView. So you are capturing 13 image pairs instead of 12 as your flex view setting suggests.
Most of the time is spent transferring the images over the network. The total exposure amounts to only (12+1) x 10ms = 130ms, but transferring 2472 x 2064 x (12+1) x 2 x 8 = 979623936 bits over a 1Gb/s link takes about 980ms. That plus some time for packet headers and to parametrize the camera and you arrive at about the 1.2s you measured.
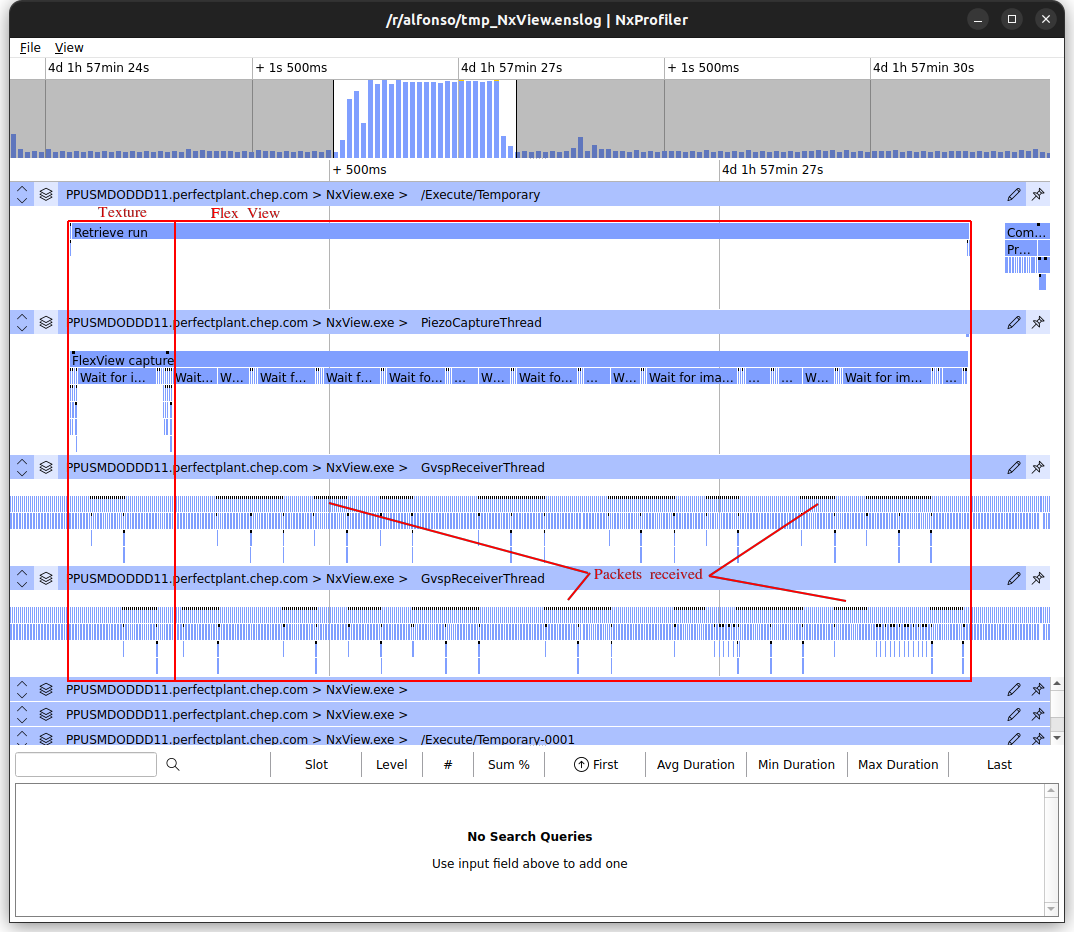
For this analysis, you want to focus on the thread running your command, as well as the PiezoCaptureThread and the GvspReceiverThreads:
The piezo capture thread controls the capture sequence for the camera, changing between projector and front light for the texture image and triggering the flex view frames. The GVSP receiver threads accept packets containing image data, one thread per camera (left and right). The sequences of black marks (of which I have highlighted a few) indicate packets being received. Only one thread at a time receives data because we alternate sending images from the two cameras as they share the same network link and thus cannot simultaneously transmit at full bandwidth anyways. But as you can see, packets are continuosly being received, and closer examination shows no packet loss. Bandwidth limit is disabled in your settings, so this is about as fast as it gets.
Thank you for your detailed response—it really helped me understand the timing breakdown and network transfer constraints.
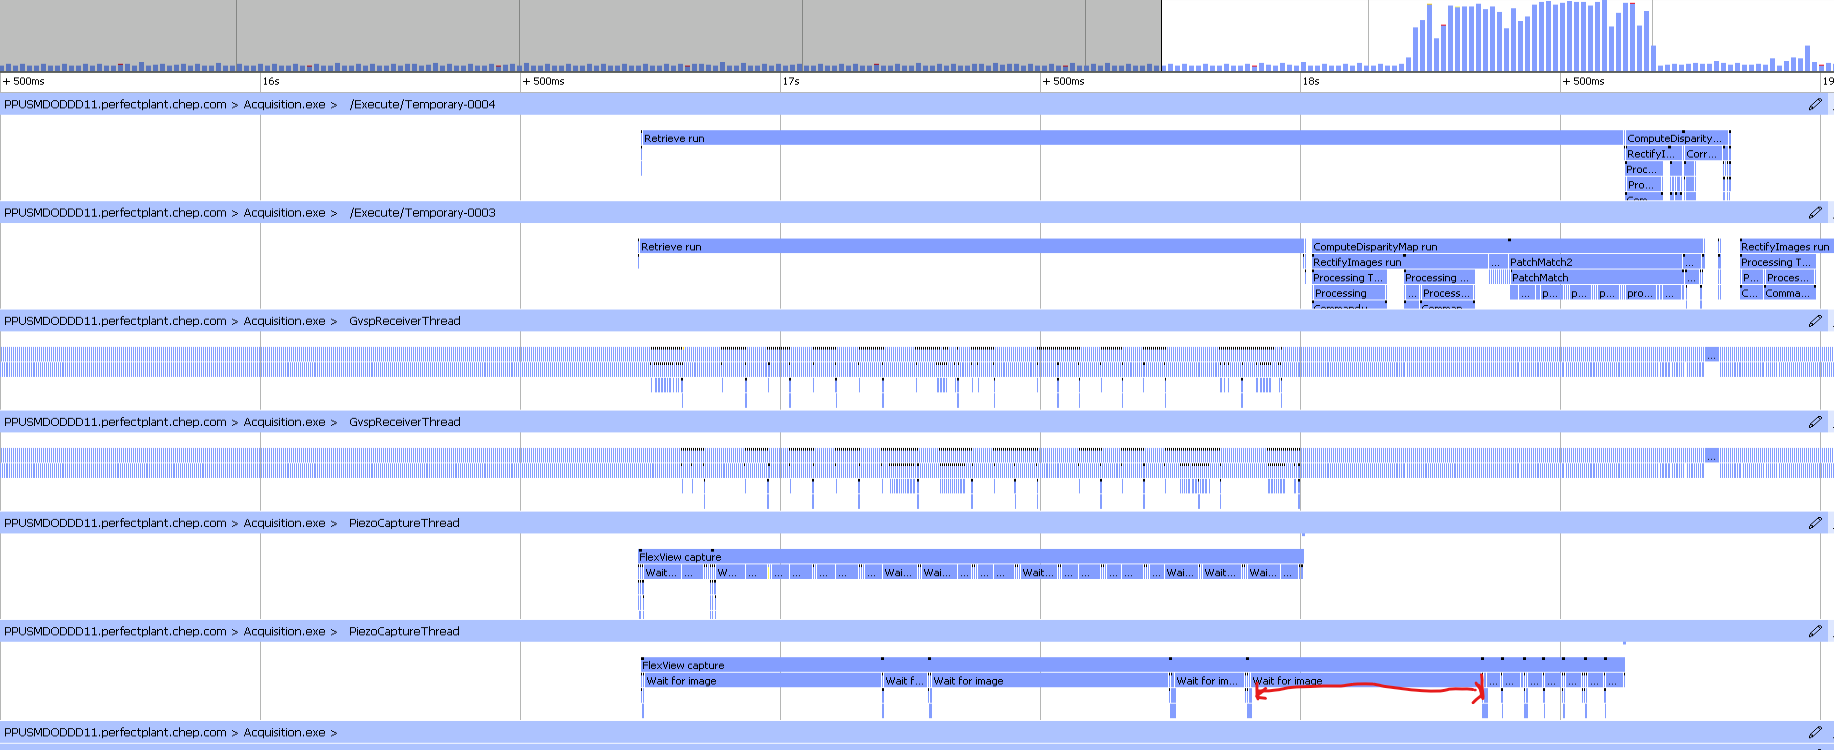
I have another question. I’m attaching a log I acquired using a C57 and an X36 at the same time. The overall times are increasing, which I assume is due to network capacity. I’m checking the PiezoCaptureThread to confirm this, but I’d like to better understand the sequence of FlexView captures.
Specifically, do the different FlexView captures start one after another as soon as the exposure time has passed, or is there some additional delay? I’m checking the WaitForImage step in the PiezoCaptureThread to analyze this—would this be the best place to look in the profiling data, or is there another metric/thread I should focus on?
When you have more than one camera on the same network adapter, they must share the total bandwidth, so naturally the transfer times increase.
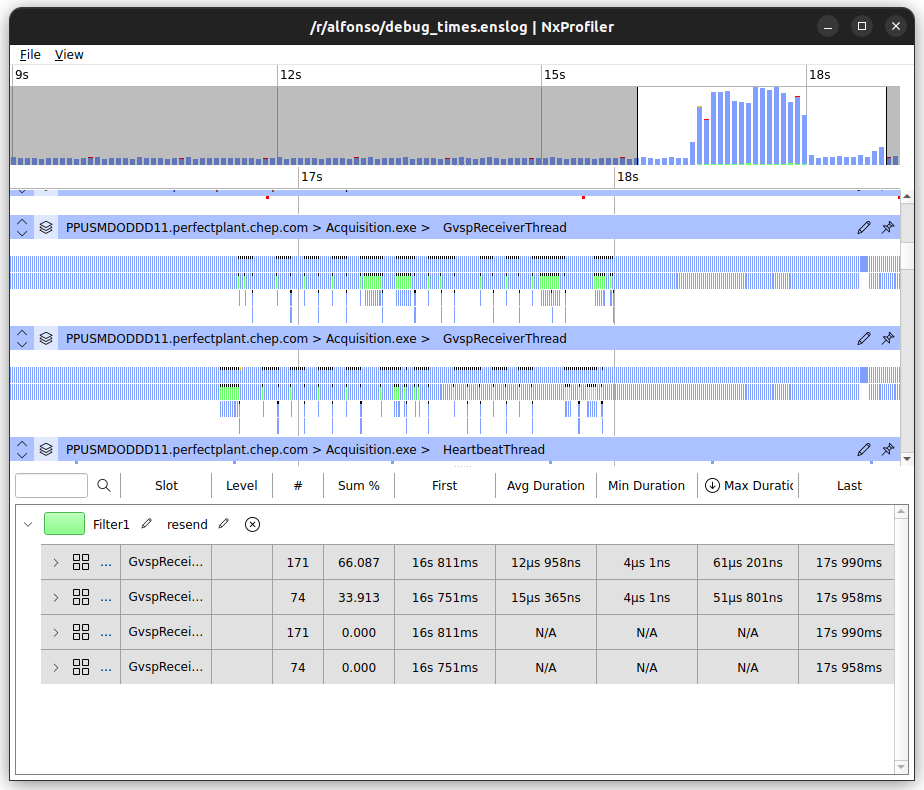
When you look closely at the GvspReceiverThreads, you see that when you operate both the C-series and X-series together, the NxLib is requesting a lot of resends of data packets from the C-series:
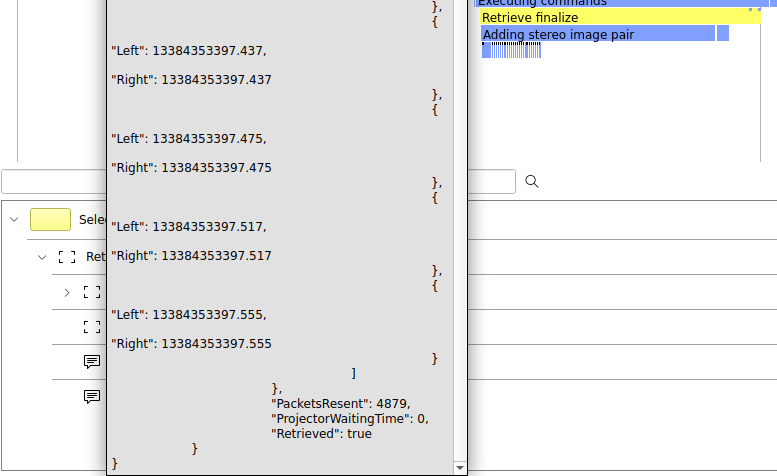
You can check the number packet resends in the PacketsResent node in the results of the Capture and Retrieve commands, if you want to monitor this in you application. NxView, for example, shows a warning if the resend count exceeds 1000.
Because the command results nodes are always included in the log, a search for “Command result as JSON” or “PacketsResent” reveals that the C-series requires 900 resends and the X-series 4879:
The UEye driver only provides the total for the UEye cameras on the X-series, not the individual resends as the GV-based C-series does, which makes problems harder to spot in the log file.
Resends are usually a sign that the network link is overloaded. I can see that you have both cameras connected to the same network adapter, so I guess that it is 1G and that the bandwidth limit for the cameras is either not set at all or set too high.
The advice here is, that when you capture with multiple cameras simultaneously, then the sum of bandwidth limits for cameras on the same network adapter should not exceed that adapters total bandwidth.
This is a really complex topic and would take to long describe exhausitvely, so here is only a quick overview, describing the current state in 4.1. We try to minimize the interframe delay for flex view sequences; how well we manage that depends on the camera model:
For the X-series we usually trigger each pair from the host PC as soon as the previous pair is received.
In contrast, the C-series is triggered only once by the host PC and then manages capture of the entire flex view sequence internally. Because we can buffer the images on the device, we do not have to wait for transfer over the network.
This allows for a shorter delay between two flex view frames on the C-series, where we mostly only wait for the exposure, as compared with the X-series, where we wait for exposure and transfer. The total remains similar in most cases because it is dominated by the network transfer.
First you should change your setup or your settings so you avoid packet resends. Then you are looking in the right place. But because of how each model operates, as detailed above, there are different amounts of information available there.
Can you share some details about your goals, then I might be able to give you some more concrete pointers for optimization.
Thank you for the detailed explanation; it was really helpful.
In our case, knowing exactly when all captures have been completed—regardless of whether they have been transferred—would be very useful, as we need to perform an operation on the object being captured as soon as possible.
I understand that with the X36 this is not feasible since we wait for exposure and transfer, but is there a way to achieve this with the C57?
It is currently not possible to get from the NxLib the information when all the images have been captured and it is safe to manuiplate the scene. The C-series does not provide this information and the NxLib has no way yet to present it. We already have a ticket for fixing both these issues: #3629, which is planned for the next release, which itself is planned for May. The issue has collected lots of ideas but no implementation yet.
The only way I can think of to reliably get this information now is to count the edges on the flash out GPIO signal, but for that you would have to bypass the NxLib or abuse another camera.
Thank you for the clarification—it’s good to know that this is already being tracked. Is there any way to follow the progress of issue #3629?
Regarding the C57, since it can buffer images without waiting for transfer, would it be possible to determine how long it takes to complete all captures (i.e., fill the buffer)? If we could estimate this time, we could move our object in parallel after a fixed waiting period, even while the images are still being transferred.
Our issue tracking system is not publicly accessible, so there is no way for you to track the current state of the, apart from asking on a regular basis. I would suggest starting mid-May, that still leaves us about a month to finish the feature.
After the exposure starts on the camera, which should be pretty much the same time the Trigger command returns, the earliest you may move the scene is after exposure x flexview + overhead x (flexview-1), where overhead is between 30ms and 40ms, depending on how adventurous you feel. So for an exposure of 3ms and flexview 12 from the settings file you attached to the top post, that would be somewhere between 370ms and 480ms.
That is, of course, if you operate the camera within the projector duty cycle limit. As soon as the camera has to wait for the projector, the simple estimate is not valid anymore and estimating the true minimum becomes much harder. But with the performance you are aiming for, you do not want to run into the duty cycle limiter anyways.
One way you can verify the estimate experimentally would be to film the projector with a high enough framerate and measure the time from the beginning of the first flash to the end of the last. That is precisely how long the scene must remain static for.
If anyone asks, you don’t now any of this from me.