We have noticed that the point cloud calculations for the first image capture is taking a long time. It seems to happen after opening the camera. We notice this both on our own product and in nxView. We are now developing on Linux, but have also seen similar behavior on Windows.
Typically it is the ComputeDisparityMap command that takes longer time on the first image, e.g. after the first image capture the command takes 1.2s to 1.7s and following time is 0.3s. We have also seen times up 89s on the first image.
We also use RenderPointMap on the C57 camera, and we also see similar behavior for this command.
Do you recognize this behavior and do you know how to solve it? (A workaround could perhaps be to capture an image after opening the camera, and then we will be ready to get pointclouds at full speed)
We keep a lookup table internally to speed image rectification, which is calculated on the first execution of either RectifyImages or ComputeDisparityMap, which also implicitly rectifies the images if you are not calling RectifyImages yourself.
None of these should take nearly as long as you are describing on any sufficiently capable hardware, and their runtime should be more ore less constant.
We did have a couple of issues recently when using CUDA with newer Nvidia drivers, that might be something to look into, if you are using CUDA at all. That RenderPointMap also takes longer would also point there.
It would be best if you could provide a log from the NxLib showing the overly long commands of the first frame and maybe two or three after that, so I can also see what the actual execution should be. We have a guide on Exporting Debug Information in our manual. You can attach it directly to your reply or DM it to me if the log contains sensitive information.
I have a quick look on your log file. Indeed, the first run takes 4.6 seconds, which is the sum of ComputeDisparityMap (1.8 seconds) and RenderPointMap (2.8 seconds).
All points mentioned by Raphael remain valid:
The long first run of RenderPointMap probably indicates problems with the OpenGL/NVIDIA driver.
The long first run of ComputeDisparityMap is the preparation of resources for future commands.
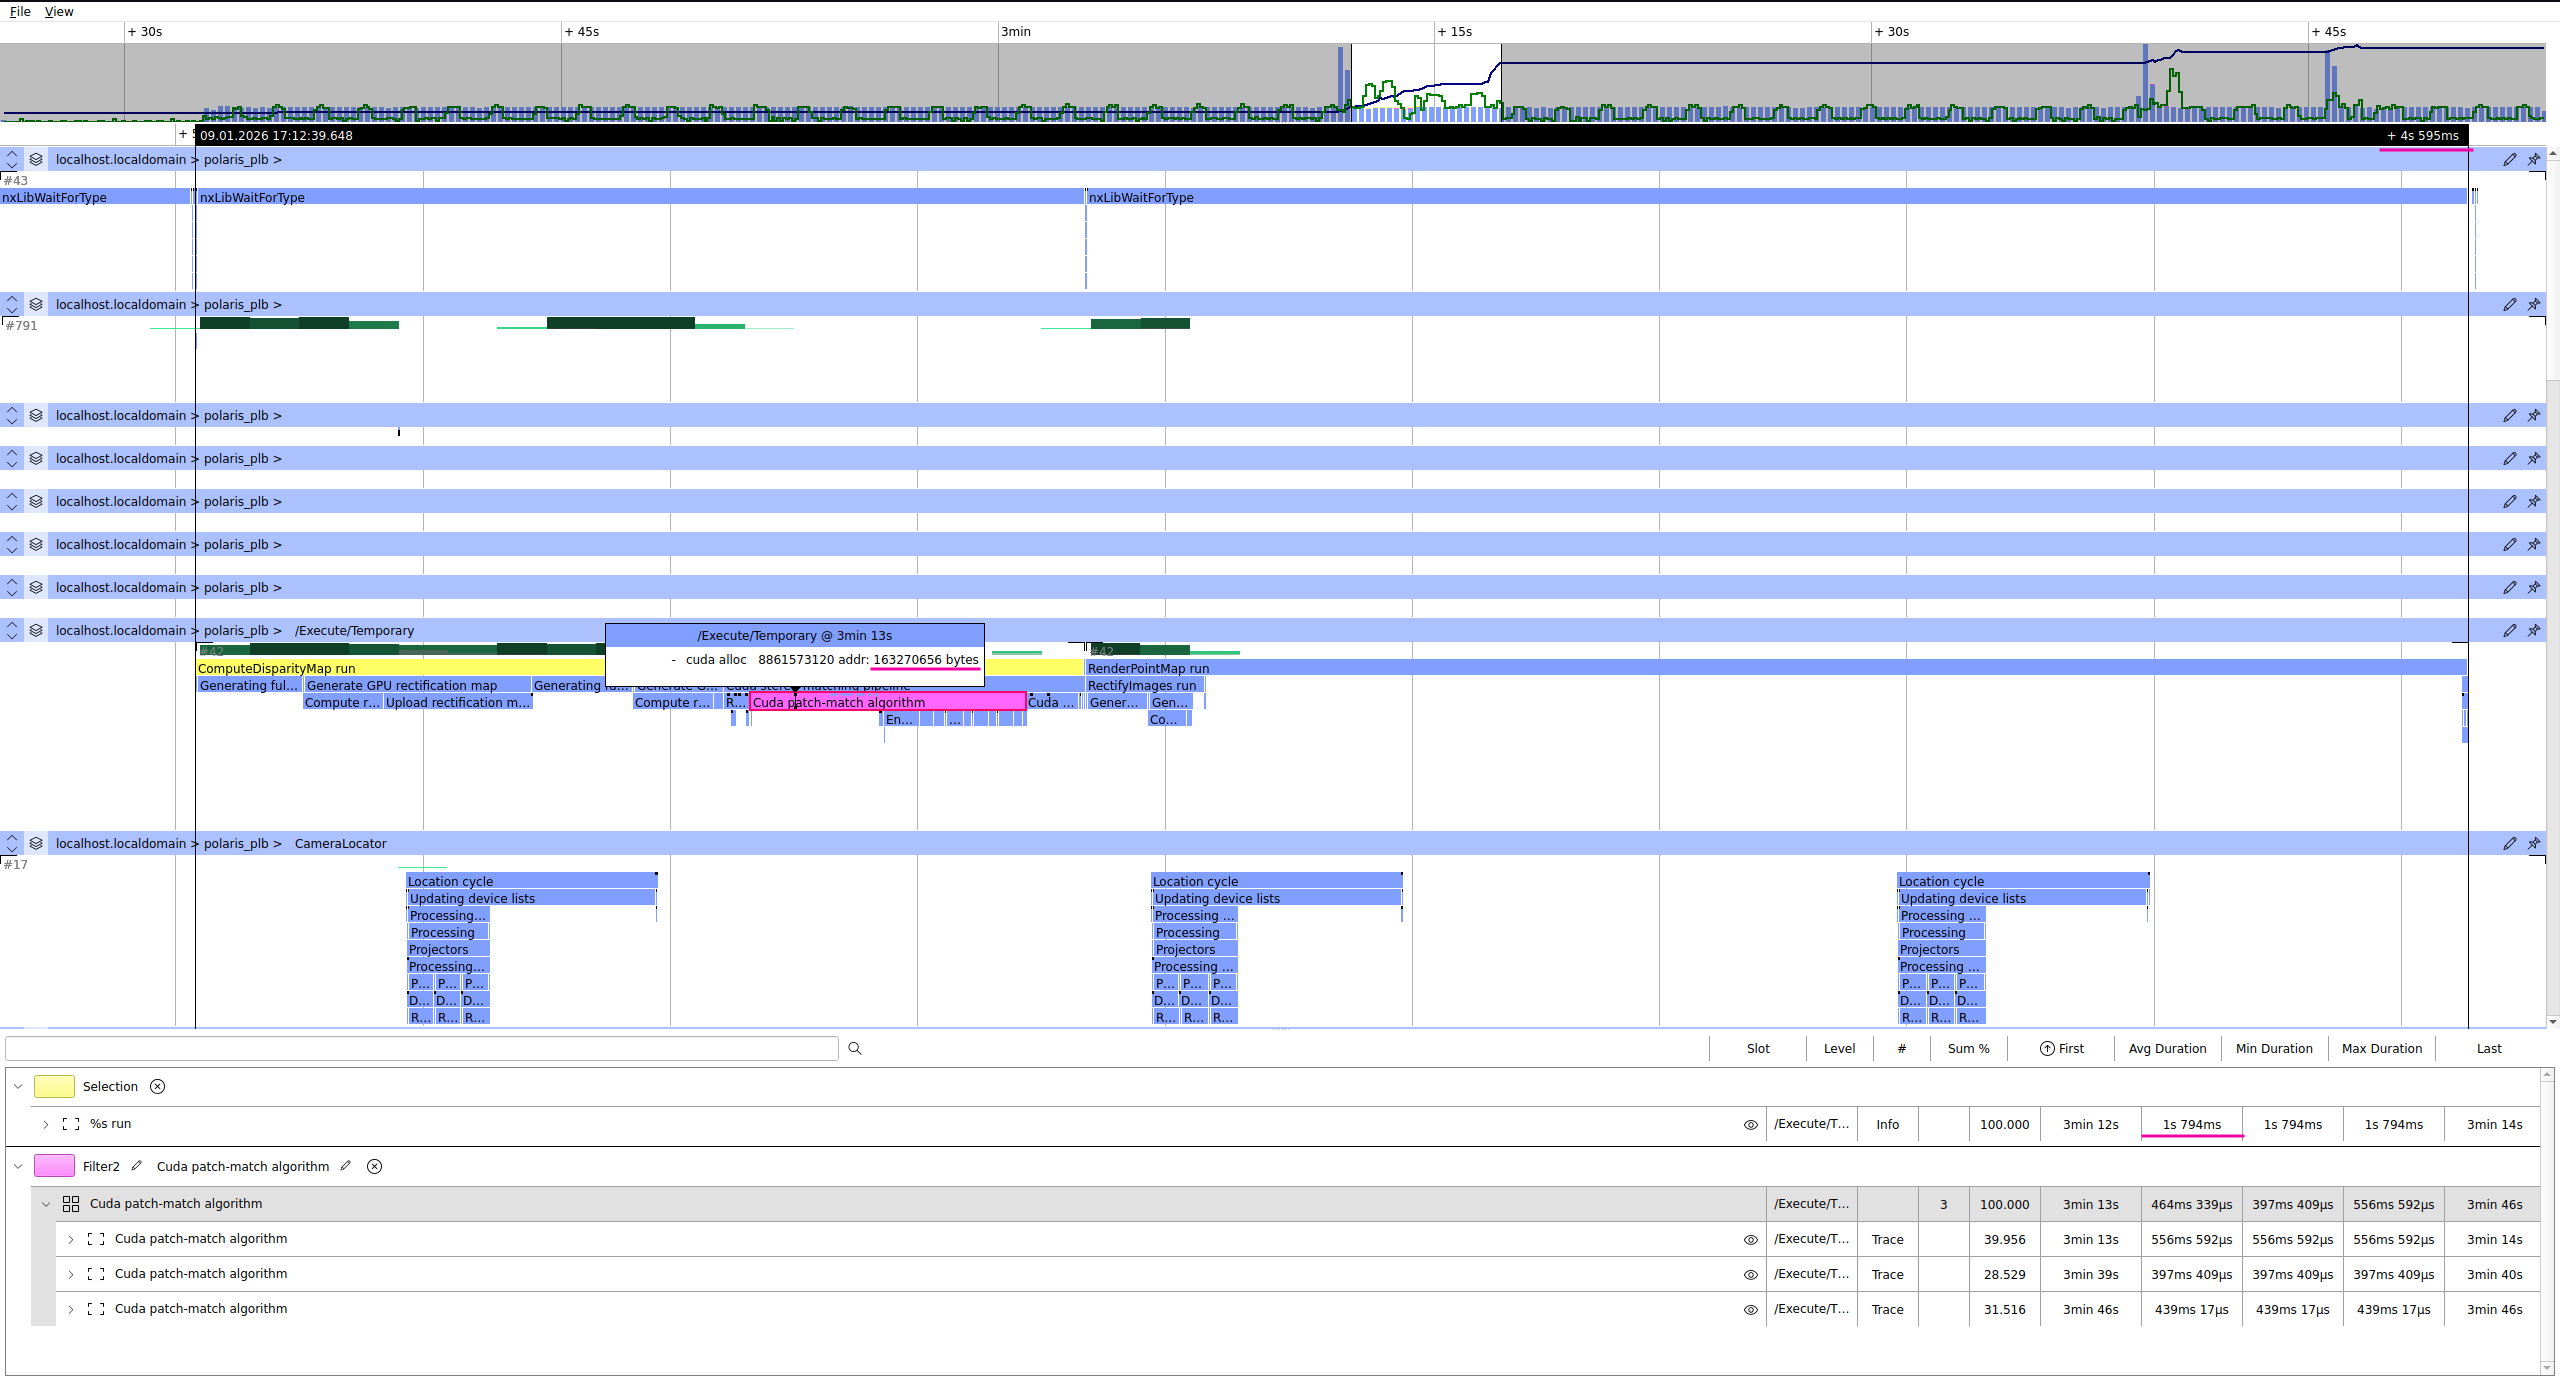
The “Cuda stereo-matching pipeline” takes 726 ms of the 1.8 s; the rest is preparation of resources for fast rectification. The “Cuda patch-matching algorithm,” in turn, spends 170 ms on GPU memory allocations. According to your log file, it allocates 545 MiB of GPU memory. These allocations were all cached and reused during subsequent runs.
I verified the size of the allocations, and they are as expected. For example, when using tilted patches, PatchMatch encodes images with a 256-bit descriptor per pixel. Thus, you have (2472 × 2064) pixels × 32 bytes = 163270656 bytes, which is the size of the first allocation, see the screenshot attached.
Although all preparation steps are necessary during the first run, their durations (especially RenderPointMap) are unexpectedly long. The only explanation I have at the moment is that there are some problems with the recent OpenGL/NVIDIA driver. It would be helpful if you could provide your GPU model and the driver version. You can get all of this information by running the nvidia-smi utility in a terminal. Ideally, you could share with us the file-camera of the scene with which you created this log.
could you also run the command nvidia-smi --query-gpu=name,compute_cap and paste the results here? We build our CUDA code using a very old version of PTX (the assembly for NVIDIA’s virtual architecture intended for future devices). Usually this is not a problem, because the NVIDIA driver compiler builds the PTX code on the fly. It is possible that this initial compilation is the reason for the delay during the first runs of the CUDA code.
Ah, you have the Jetson Orin. Then I’m pretty sure this delay is from the NVIDIA driver’s JIT compilation. We compile CUDA code for Jetson with a compute capability of 62, but yours is 87. Thus, the driver compiler has to recompile the PTX code first. I don’t currently have a Jetson Orin, but if I find one, I’ll try to reproduce the delay.
we have a Jetson Orin Nano now and could reproduce your measurements. There are different delays at play here.
We have also seen times up 89s on the first image.
This is the compilation of CUDA kernels from the PTX code we ship for your specific GPU and driver. After it happened once, the result is cached in ~/.nv/ComputeCache and subsequent runs don’t have to do this step again. The cache is invalidated when you update the Ensenso SDK or the Nvidia driver.
The advantage of this compilation step is that the kernel gets optimized for your specific GPU.
after the first image capture the command takes 1.2s to 1.7s
This is the initialization of the CUDA context and similar things, which happens lazily when the process uses CUDA for the first time. This is normal and happens on all systems. It is particularly noticeable on the Jetson, though, probably because its CPU is relatively slow.